|
|
|
|
Streamlining Threat Response and Automating Critical Use Cases with Security Orchestration, Automation and Response (SOAR)
Asia Othman Aljahdali 1, Raghad Alsulami 1
1 University of Jeddah,
College of Computer Science and Engineering, Cybersecurity Department Saudi,
Arabia
|
|
|
ABSTRACT |
|
|
Incident
response (IR) is the process of detecting the existence of a threat and
minimizing its impact. The incident response team needs to work proactively
to defend the network against cyberthreats. Streamlining and automating the
threat response process will achieve this goal and enhance the incident
response workflow. Automating important use cases enables the incident
response team to focus on the analysis and decision-making processes. The
most common critical use cases in today’s cyberspace are brute-forcing,
vulnerability management, port scanning, and phishing. Security orchestration
and automation (SOAR) technology complements the existing technologies to
provide continued security. This study is an implementation of an automated
system that aims to facilitate incident response in Security Operations
Centers (SOC). The project will streamline several critical uses ceases that
would prevent phishing attacks, brute force attacks, port scanning, and
detect vulnerabilities on Windows OS. This project is not just to generate an
automated response but is focused on improving the response as optimally as
possible. The automation responses are done in compliance with cyber security
best practices. |
|||
|
Received 12 March 2025 Accepted 16 April 2025 Published 20 May 2025 DOI 10.29121/DigiSecForensics.v2.i1.2025.45 Funding: This research
received no specific grant from any funding agency in the public, commercial,
or not-for-profit sectors. Copyright: © 2025 The
Author(s). This work is licensed under a Creative Commons
Attribution 4.0 International License. With the
license CC-BY, authors retain the copyright, allowing anyone to download,
reuse, re-print, modify, distribute, and/or copy their contribution. The work
must be properly attributed to its author.
|
|||
|
Keywords: Incident Response, Cyberattacks, Security
Information and Event Management (SIEM), Security Operations Centers (SOC) |
|||
1. INTRODUCTION
Over the last 10 years, the use of technology has increased hugely. Although this development has many beneficial impacts, it also introduces new security risks, leading to numerous consequences. As a result, we must raise security levels by automating some practices as a threat response to avoid or reduce the level of risk posed by these technologies.
While technological advancements make our lives easier, rapid changes in the country have increased security risks. Enterprises need security operation centers to be working 24 hours a day, seven days a week, to monitor and defend the network. Employees in the Security Operations Center are receiving a massive number of alerts and log data, which may increase the level of human error and the time it takes to respond to an incident. The employees need to save their time and effort to focus more on the analysis of ultra-critical threats. This study automates some SOC practices to avoid doing tedious, time-consuming, repetitive tasks.
Security orchestration, automation, and response (SOAR) refers to technologies that enable organizations to collect inputs monitored by the security operations team. For example, alerts from the SIEM system and other security solution can be used to define, prioritize, and drive standardized incident response activities, where incident analysis and triage can be performed by leveraging a combination of human and machine power. SOAR tools allow an organization to define incident analysis and response procedures in a digital workflow format. For example, an employee receives a targeted email from an attacker containing malicious links; immediately, the SOAR solution detects this event and triggers the corresponding playbook. This playbook can be considered a response to a specific event. The triggered playbook examines the trustworthiness of the link and takes an action such as blocking the sender’s email from sending further email, logging out the corresponding employee from his system, etc. Team (2019).
The aim of this project is to facilitate and accelerate the incident response process. This improvement is enabling the security operation center team to focus on analysis and decision-making in an effective manner rather than doing manual, tedious, and time-consuming tasks. The project will streamline threat investigation and mitigation by coordinating and automating as many steps in the response workflow as possible. This paper is dedicated to helping security operation center (SOC) employees. It provides a standardized data aggregation process to facilitate human analysis and automates detection and response processes to reduce alert fatigue, allowing SOC analysts to focus on tasks requiring analysis and more in-depth human intervention. It is very clear that the effectiveness of a SOC team directly depends on its technological solutions. One specific technology solution that enhances almost every part of a SOC team is SOAR. In this project, security orchestration, automation, and response will be integrated with security information and event management (SIEM) and other security tools to enhance the SOC workflow.
2. BACKGROUND
The goal of incident response is to either prevent or mitigate an attack. The National Institute of Standards and Technology (NIST) defines four phases of incident response: preparation, detection and analysis, containment-eradication-recovery, and post-incident activity. Based on their tasks and experiences, these four phases were assigned to two different teams. The first team is the computer security incident response team (CSIRT), the second is the security operations center (SOC), and CSIRT is responsible for containment, eradication, recovery processes, and post- incident activities. SOC oversees detection and analysis. This structure differs from company to company depending on their size and objectives, but in general, SOC is responsible for monitoring, and CSRIT performs the actual response or action. SOC and CSRIT are often used interchangeably in small businesses. Automation speeds up typical responses and repetitive tasks, so little or no human intervention is required to identify and respond to security threats and incidents. Incident response automation also aims to help organizations achieve a 24/7 defense system.
SOAR is a platform that enables organizations to collect data about security threats and respond to security events automatically, with no human interaction needed. The purpose of using the SOAR platform is to boost physical and digital security operations’ efficiency. Security orchestration connects and integrates multiple internal and external tools through built-in or custom integrations and application programming interfaces (APIs). Connected systems can include vulnerability scanners, endpoint protection products, end-user behavior analysis, firewalls, intrusion detection and intrusion prevention systems (IDS/IPS), security information and event management platforms (SIEM), as well as external threat intelligence feeds. Security automation, powered by data and alerts collected by Security Orchestration, ingests and analyzes data and creates repetitive automated processes to replace manual processes. Tasks previously performed by analysts, such as vulnerability testing, analyzing log data, auditing tasks, and ticket generation, can be standardized and performed automatically by SOAR platforms. By using artificial intelligence (AI) and machine learning to decipher and modify analyst information, SOAR automation can make recommendations and automate future responses. Alternatively, automation can amplify threats if human intervention is required. Predefined or custom playbooks are defined as automated responses or actions. For example, if a malicious uniform resource locator (URL) is found in an employee email and identified during a scan, a playbook can be set up in such a way that it blocks the email, alerts the employee to the potential phishing attempt, and blocks the sender‘s address. The impact of implementing SOAR in an ad hoc manner without thinking about the underlying details could be severe. One of the consequences is increasing the complexity of the system, which may lead to other operational problems. The SOAR platform can be described as a hub to unify all the security activities related to the security devices used in the organization. As a result of this uniformization, the organization should have a single point of view to manage its operational and supportive needs in an efficient manner. However, the haphazard integration method and lack of planning may result in the opposite. In addition to that, some SOAR platforms do not provide fully detailed documentation on how to integrate the SOAR platform with different security devices and guidelines for successful deployment, so this will cause an increase in the system’s complexity Kallimath and Savalagimath (2021).
3. RELATED WORK
The study in Islam et al. (2020) introduces an architecture-centric approach for implementing SOAR. The architecture-centric approach suggests that by modularizing functional and non- functional requirements, the complexity of the system will be reduced to an acceptable level. Their Approach consists of three parts: SOAR platform design and space abstraction, layered architecture for the SOAR platform, and proof of concept SOAR support.
The first attribute is the integrability; as mentioned before, SOAR is considered the hub for all the security devices, which may come from different vendors. There- fore, organizations need to design an architecture for a SOAR platform that provides seamless integration and adaptation. Additionally, other attributes that need to be satisfied in the architecture are interoperability, interpretability, flexibility, and usability. The researcher does not mention the” performance” quality attribute, which is an extremely important attribute. To contain the attack or threat in its early stages, the incident response process necessitates high-performance capabilities. One of our project’s use cases is detecting phishing emails and blocking the sender to prevent malware from spreading on the network; however, using the slow SOAR platform increases the time required to detect the attack and block the sender. As a result of increasing the response time, the threat will be huge and unacceptable. Since SOAR is a new technology, organizations will integrate it on top of the security tools they already use, so there is no chance to design the overall architecture from scratch. The researcher only recommends that the architect needs to understand the SOAR plat- form core design to integrate it and fulfill the security needs. But understanding the already-existing architecture of the organization’s network is a must, and inventorying the security tools, network devices, and endpoints is indispensable. The lack of under- standing of the existing architecture may lead to inefficient incident handling. The proposed architecture in Islam et al. (2020) uses open-source tools. Organizations do not use open-source tools as frequently as they should because their services require ongoing support and maintenance. Therefore, the proposed architecture does not demonstrate real-life scenarios.
Nguyen et al. (2023) develops SOAR4BC framework, which is AI-based SOAR solution to improve recovery by ongoing learning of system status, to improve recovery by ongoing learning of system status and control efficacy, allowing self-healing at many CI system levels. The framework includes: 1) Intelligent decision-making approaches for managing business continuity risks and incidents. 2) Multi-layer SOAR decision-making and orchestration techniques.3) Real-time customized support in the form of avatars, as well as automatic development of response recommendations for CI and SOC operators. 4) Methods for ensuring compliance with NIS Directive 2.0’s cybersecurity information sharing policy.
The Incident Tracking System (ITS) in Ohmori (2019) combines various information systems and automates an initial incident response. ITS finds and isolates a suspect host, mails the Computer Security Incident Response Team (CSIRT), and after that identifies a user of the suspect host. The workflow of the incident tracking system (ITS) can be recapped as follows: Firstly, the logging system keeps the required logs. After that, the security operation center (SOC) determines a breach of security and emails an alert. The alert parsing system receives the alert mail, investigates it, and then creates a ticket on ITS. It is then given to the ITS, which has a quarantine confirmation system, which inspects antivirus logs and returns its results to the ITS, which requests the host locating system to detect a host, obtains point of contamination (PoC) information by querying an IP address database, obtains the user of the suspect host by querying a user identification system, and requests an alert. Here is where the process of initial incident response terminates and the CSIRT job starts. The CSIRT team will manually recognize the suspect host and plug off the LAN cable, investigate the suspect host and what happened if necessary, and eventually check if there is any opportunity for information compromise or not. Finally, the CSIRT team will summarize the incident and close the ticket on the system. The proposed system offers many features, including minimizing the time needed to isolate a host and sending an alert email in less than 40 seconds. The manual operation, on the other hand, needs more than 30 minutes, hours, or days. In addition, the system avoids misoperation caused by a false-positive report. Also, ITS workflow simplified the proposed combined status, so a CSIRT member can easily change the status of an incident without referring to any document on incident response. On the other hand, the proposed system has some limitations. The first limitation concerns host isolation. The hosts could be isolated by mistake due to a false positive alert. Second limitation: reliability of SOC alerts; all the alerts should be checked to see if they are false positives or not. System developers assumed that the reliability of SOC alerts depended on the organization. This limits the automation of the initial incident response Ohmori (2019).
CSBAuditor is an IDS specialist for cloud storage systems, including identity and access management components. It has helped with preventive capabilities but lacks investigation and response techniques. To respond effectively to security incidents, a study in Torkura et al. (2019) suggests SlingShot as an extension of CSBAuditor’s capabilities. SlingShot helps detect violations of specific security features such as unauthorized modifications to container policy, persistent API queries against resources, and the deletion, creation, or modification of policies, roles, or users. Moreover, symptoms of a persistent attack can be detected through security event correlation techniques and eliminated. To achieve this goal, the first security updates must be retrieved from CSPs in an ongoing manner. Security events must be linked to alerts recorded in CSBAuditor. The results of the association must be used to identify and stop ongoing or suspicious security attacks. A report must be made of what has happened and the required and appropriate effects for further analysis, such as forensic investigations.
The IR life cycle defines the procedures that must be adopted for effective responses to security incidents. It also defines standards and best practices for IR security, such as CSA, that you will rely on because it is specifically designed for cloud environments. In SlingShot, all components are implemented in Java.
SlingShot is evaluated using two IR metrics: the mean time to detect (MTTD) and the mean time to respond (MTTR). MTTD is defined as the average amount of time taken to detect a security event in the cloud. Similarly, MTTR is the length of the period it takes from incident detection to containment or eradication. This metric demonstrates the capability of an IR system to eradicate attacks. MTTD and MTTR are key performance indicators for IR; shorter values indicate better security. Additionally, SlingShot has been tested in both dynamic and static environments; the MTTD and MTTR are much better; however, reaction time can be improved if CSP supports real-time log delivery. So, SlingShot is better than traditional systems, where intruders stay in compromised systems for over 200 days on average before being detected Torkura et al. (2019).
4. COMPARISON CRITERIA
A comparison between the previously mentioned studies is done based on the feasibility, performance, flexibility of integration, prebuilt playbooks, and the false-positive rate.
Table 1
|
Table 1 Comparison Results |
|||||
|
Ref. |
Feasibility |
Performance |
flexible integration |
pre-built playbooks |
False positive rate |
|
Islam et al.
(2020) |
Low |
Not
defined |
medium |
Low |
High |
|
Nguyen et al. (2023) |
Low |
Medium |
High |
Null |
Not
defined |
|
Ohmori (2019) |
medium |
High |
Low |
NULL |
High |
|
Torkura et al. (2019) |
medium |
high |
low |
low |
medium |
The feasibility of the incident response solution is important. Some related projects and the existing solutions are very hard to implement or have a low degree of being easily or conveniently done. High performance in automation solutions is a must, especially in the incident response process to prevent threat distribution. Also, the flexibility of the integration process is important in such a project because new tools and technologies are coming, and we need to ensure that the system is extensible. Pre-built playbooks refer to the number of pre-generated responses available. Finally, it is very important to keep the false positive rate low, especially when it comes to security and automation. See Table 1.
In conclusion, the research’s findings are helpful for most projects related to incident response automation. The architecture-centric approach is explained in detail and provides a good level of agility while also decreasing the complexity of the system. However, there is some ambiguity in some proposed design decisions. Also, the researcher did not mention the need for a high level of compatibility between the SOAR platform and the SIEM platform. Also, the use case proposed by the researcher lacks important security tools like firewalls, an active directory server, antivirus software, and vulnerability assessment tools. In addition, the security tools used are open source. As a result, the use case does not demonstrate what happens in real life. The researcher should have focused more on providing different options for a different sector or making the use case more general and comprehensive.
Streamlining threat response and automating critical use cases with security orchestration, automation, and response projects provides a great level of reusability. A company can use the SOAR platform to find a suitable playbook for a specific incident and re-use it. The Incident Tracking System (ITS) has a good level of minimizing the time needed to isolate a suspect host, which is also important for streamlining threat response and automating critical use cases with security orchestration, automation, and response projects. Furthermore, the system avoids misoperation as much as possible due to false-positive alerts and has a simplified workflow. On the other hand, false-positive alerts have the potential to isolate hosts by mistake. This flow will reduce the availability of any host in the organization to an unacceptable level. The ticketing system reveals the desired level of automation needed in the SOC work- flow. On the contrary, streamlining threat response and automating critical use cases with security orchestration, automation, and response projects minimize the human interaction tasks to improve the efficiency of the SOC workflow. SlingShot responds to incidents and detects security violations in effective ways through security event correlation techniques, which are used for streamlining threat response and automating critical use cases with security orchestration, automation, and response projects, specifically in creating SOAR playbooks. SlingShot is better than traditional systems, where intruders stay in compromised systems for over 200 days on average before being detected. But CSP reaction time does not support real-time log delivery, so the response time may be delayed at times Nyre et al. (2019).
Figure 1
|
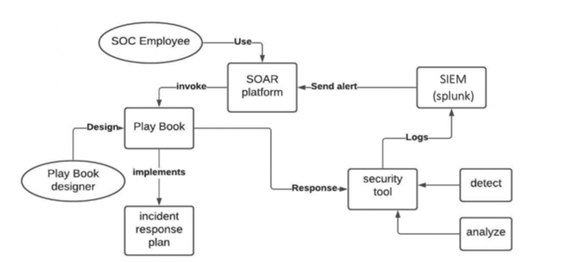
Figure 1 Architecture Diagram of the Proposed Automated Threat Response System. |
5. PROPOSED
SYSTEM
We proposed a system that streamlines threat response and automates critical use cases with security orchestration, automation, and response (SOAR). The system will detect brute force attacks, port scanning attempts, and phishing attacks and generate alerts. The system will be able to respond to brute force attacks, generate an automated response to port scanning attacks, and generate automated updates to the vulnerable endpoints. Additionally, the system will be able to block the sender of the phishing email.
In this project, we will use a virtual version to simulate a real-world company’s network, which usually includes routers, firewall, and desktop. The main desktop computer has 16 gigabytes of RAM ,1 terabyte of capacity, and an i7 processor. Also, we will use a hardware firewall to improve the efficiency of the system since the hardware firewall has a separate physical resource. A router will be needed to connect to the internet. In addition to that, we will need a virtual version of Windows Server Zwuiany (2015)
The system architecture diagram visualizes the layout of the automated threat response system, which explains the components of a system and their major functions, see Figure 1. We simulate the network architecture of medium-sized companies and integrate a SOAR solution to enhance the efficiency of the workflow. The main machine runs the Linux operating system. The SIEM server is then integrated to collect data from network resources such as the intrusion detection system (IDS) server, vulnerability scanner, firewall, and endpoint devices. Then, we create a specified set of rules in the SIEM to detect threats and generate automated alerts. We use the SOAR platform to create a customized playbook that will be triggered automatically when SIEM generates an alert. The playbook contains a list of specified commands to respond to the threat. The proposed system will automate four critical use cases by detecting four threats and generating an automated response. Each one will be described below.
Use Case 1: Existing Vulnerability in a Host. In this use case, we will introduce a robust solution to keep the network up to date. Today’s security staff are confronted with more vulnerabilities in their environment than they can effectively address on their own. What’s the result? A growing backlog has built up to the point where issues are sliding through the cracks, putting you at risk if certain steps aren’t addressed promptly. A SOAR solution should interact with your existing tools to orchestrate vulnerability management procedures from notification through remediation, ensuring that critical concerns are addressed with every security advisory that comes in—while maintaining human decision points where they are most important. Scans, patches, remediation verification, and more can all be automated Purujoki (2020).
Use Case 2: Port Scanning Attack. Port scanning is one of the most common cyberattacks. It is not only about identifying the open ports; port scanning can reveal critical information about the company, which may have a severe impact. In this scenario, we will use SOAR technology to stop the attacker from gaining information and launching further attacks. First, we will extract the packet information, such as the attacker’s IP and packet size. These details will assist us in determining whether the packet is legitimate or a port scanning attempt. SIEM will analyze this information and generate an alert when detecting a port scanning attempt. Finally, the generated alert will trigger the specified playbook to respond to this incident by blocking the attacker’s IP from the firewall and filtering port Kraeva and Yakhyaeva (2021).
Use Case 3: Phishing Attack. In this type of attack, the phishing email is an attempt to steal sensitive information by email by impersonating legitimate organizations. This is done either by including a malicious file within the email and the user downloading it, or by including a fake URL for a legitimate site that takes the user to a similar site and requesting information from the user. This information goes directly to the fraudster. So, to respond, first receive the email, then parse and evaluate it to see if it contains a URL or an attachment; if it does not, simply send an email to the user and notify him. If it contains a URL, it should be sent to an analyzer to determine whether it is a malicious email. If this is a malicious email, delete it and then notify the user, if this is not a malicious email, don’t delete it; instead, send an email to the user and notify him. What if it contains attachments? Simply compute the hash and send it to the analyzer to determine whether it is a malicious hash or not and whether this is a malicious attachment. If this is a malicious hash, delete this email and notify the user; if this is not a malicious hash, send an email to the user and notify him.
Use Case 4: Brute Force Attack. In this type of attack, a group of attackers uses a botnet to initiate a targeted attempt, so the attacker starts by trying to connect to the server using a range of IP addresses, then tries again where he stopped, and so on. This technique helps the attacker evade duplicating the IP address and security controls that rely on IP blacklisting. If the botnet is used by the attacker, hundreds of thousands of attempts will be available with multiple IP addresses. To achieve reliability, there are several key steps to take when dealing with the various types of data obtained from log files. In addition, to improve the security of all hosts and reduce the risk of attack, the following steps should be followed: First, check if the IP address exists in the ARP table, and if it does, we will make sure it has the same MAC address that exists in the ARP table. This step is taken to avoid spoofing an IP address. Furthermore, we will create a whitelist containing all trusted IP addresses that have a successful login. In this phase, the log file was analyzed to find each log on the system. The system administrator can manually update the whitelist by editing it to add trusted IP addresses or remove untrusted ones. Additionally, the same process can be done automatically when a new user successfully logs in for the first time. The following step is to check the log file for each unsuccessful attempt. In this step, the log file will be analyzed. Any failed connections will be logged. Furthermore, there are two cases for any unsuccessful attempt: The first is an unsuccessful attempt by a trusted whitelisted IP address; that IP will have the capability to connect about 15 times in 10 minutes. However, if the IP address exceeds the limit, it will be blocked for 3 minutes. The second case is when other IP addresses will be considered untrusted IP addresses. The system will block this IP address if it tries to connect more than three times in five minutes. The third step is to create a list of unsuccessful attempts and then configure it. Each unsuccessful IP address attempt and the time it was attempted will be logged. Then configure a repository for all IP addresses that fail to connect. The fourth step is to check the list of failed attempts to see if a group of IP addresses in the same subnet failed to connect for a period of 3 to 10 minutes. Then all subnets of these IP addresses will be blocked.
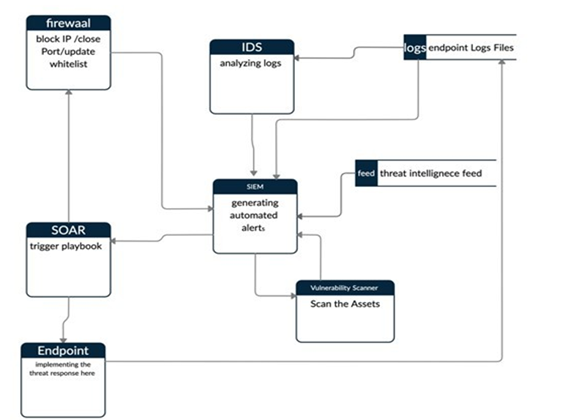
The data flow diagram in Figure 2 emphasizes the information flow, where it originates from, where it moves, and where it is kept. As shown, the SIEM will store the information from various sources to analyze it and generate alerts. These sources are intrusion detection systems, firewall threat intelligence feeds, and endpoint logs. After processing this data, SIEM will generate alerts indicating the occurrence of a threat based on the rules specified. The SOAR platform will respond to these alerts by triggering the appropriate playbook as a response to a threat. These responses may include blocking IP, updating whitelists, closing ports, and updating endpoint systems.
6. EXPERIMENTAL SETUPS
Building a cyber security operation center (SOC) is a challenging task. It is implemented by combining best practices in systems engineering with industry-accepted standards and frameworks. While some frameworks exist for designing, building, and operating specific security technologies used within SOCs, we did not find any com- prehensive framework for designing, building, and managing SOCs integrated with security orchestration, automation, and response (SOAR). As a result, SOC customers do not always get the same experience from suppliers, and they may get uneven ser- vice from geographically distributed products from the same vendor. This lack of knowledge causes an increase in false-positive alerts.
Figure 2
|
Figure 2 System Data Flow Diagram |
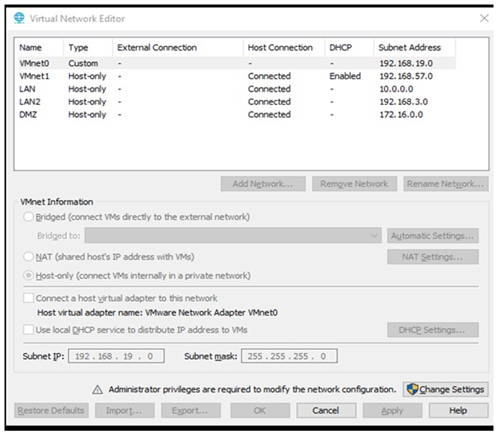
We built a virtual security operation center with a VMware workstation running Windows. This is a virtual-scale environment used to simulate some important com- ponents of a business network integrated with security event information management (SIEM) and security orchestration, automation, and response (SOAR) technologies. Windows Active Directory Services, workstations (Windows XP, Linux distributions), Windows servers, Pfsense Firewall, and vulnerability scanners; Splunk system information and event management (SIEM); an email server (Gmail); and SOAR are all common technologies used in SOC environments. The VMware Workstation hosts all the components; we’ve already used six virtual machines, including Windows Server, Tomcat, Ubuntu Linux, PFSense Firewall, Windows XP, and Kali Linux. To simulate a corporate network, we distributed the virtual machines listed above into different subnets. Our environment contains three subnets named DMZ, LAN1, and LAN2. A Virtual Network Editor tool is used to design this network architecture. Figure 3 shows the network components with their IPs.
Figure 3
|
Figure 3 Virtual Network Editor |
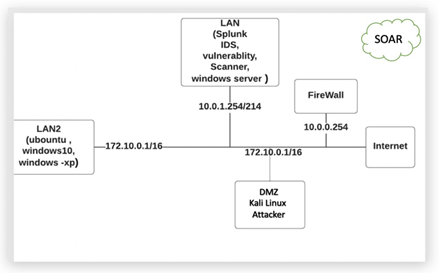
A DMZ network (known as a” demilitarized zone”) is a sub-network that contains an organization’s exposed, outward-facing services in terms of computer security. It serves as an untrusted network’s exposed point, most often the Internet. A DMZ’s purpose is to provide an extra layer of protection to a company’s local area network. While the remainder of the organization’s network is safe behind a firewall, a protected and monitored network node facing outside the internal network can access what is accessible in the DMZ. When correctly configured, a DMZ network provides additional security by identifying and mitigating security breaches before they reach the interior network, which includes critical assets. In this project, we assume that the attacker is already in the demilitarized zone, and we will prevent them from breaking the internal subnets (LAN and LAN2). Kali Linux will be used as the attacker machine, which generates all the threats, Figure 4 depicts the proposed system network architecture.
After installing these machines, we installed and configured the firewall. We have chosen the open-source PFSense firewall, which has several built-in security features, including UTM (universal threat management) with the use of Snort, which comes pre-installed with IPS functionality. This gives businesses several advantages, including preventing infections from ever reaching client computers or devices, allowing administrators to secure their network against spam across all email protocols, and giving comprehensive anti-virus, anti-spyware, and content filtering functionality. Then, we installed the intrusion detection system (IDS), Zeek. Zeek isn’t a real-time security solution like a firewall or an intrusion detection system. Rather, Zeek is considered a sensor, which is a hardware, software, virtual, or cloud platform that monitors network traffic silently and unobtrusively. Zeek analyzes what it observes and generates compact, high-fidelity transaction logs, file content, and completely configurable output that may be reviewed manually on disk or stored in a more analyst-friendly tool like a security and information event management (SIEM) system. We have installed Zeek on the Ubuntu server with customized configuration to let the Zeek IDS listen on all the subnets. Because Zeek is not multithreaded, once a single processor core’s restrictions are reached, the only alternative is to distribute the burden across many cores, or even multiple physical machines. Zeek’s cluster deployment scenario is currently the only way to develop these bigger systems. The tools and scripts that come with Zeek provide users with the structure they need to run several Zeek processes at the same time, inspecting packets and performing correlation operations as a single, coherent entity. We have edited the Networks.conf file to specify the required subnets we want to listen on.
Figure 4
|
Figure 4 Network Architecture |
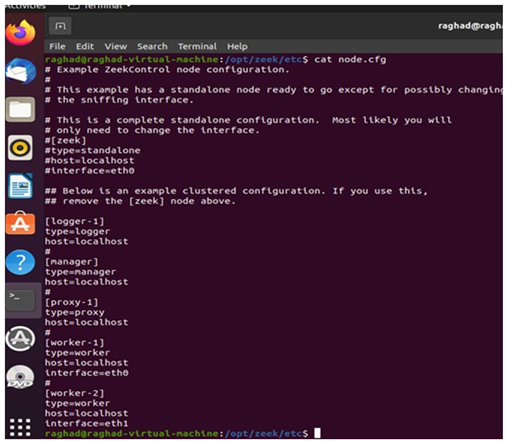
After specifying the network, we need to configure the nodes.conf file. To configure Zeek and tunnel all the traffic into the IDS, we first need to explain the Zeek architecture. The tap is a method that separates the packet stream into two copies so that one may be inspected. This is not something that the Zeek binary can perform. This work can be accomplished in a variety of ways. The manager is a Zeek process with two main functions. It uses the Zeek communications protocol to receive log messages and notifications from the other nodes in the cluster (note that if you use a separate logger node, then the logger receives all logs instead of the manager). The output is a single log rather than a series of distinct logs that must be combined in some way during post-processing. Other features and analyses that need a centralized, global view of events or data are also supported by the manager.
A logger is a Zeek process that receives log messages over the Zeek communications protocol from the rest of the cluster’s nodes. The manager’s workload is reduced by having a logger receive logs instead of the management. If no logger is required, logs will be sent to the manager. A proxy is a Zeek process that may be used to offload any burden, including data storage. Multiple proxy nodes can be found in a cluster. The default Zeek scripts use proxies sparingly, so a single one may suffice. However, customizing their use to partition data or workloads provides greater cluster scalability potential than doing similar tasks on a single machine, the manager node, that is centralized.
The worker is the Zeek process, which sniffs network traffic before performing protocol analysis on the reassembled streams. The workers perform most of the work in an active cluster, and as a result, the workers often represent the majority of the Zeek processes running in the cluster. Because all the protocol parsing and most analysis will take place here, the fastest memory and CPU core performance you can afford are suggested. Because almost all logging is done remotely and very little is written to disk, there are no special disk requirements for workers. Figure 5 shows the configuration of our nodes.
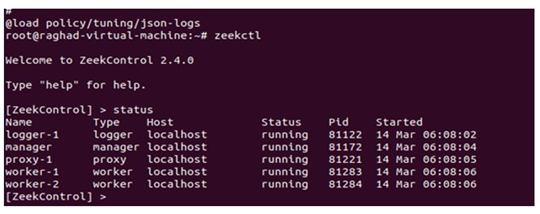
After configuring zeek we will test our scripts using the status command to ensure that all nodes are running. Use the diag command to get diagnostic information if any nodes have a crashed state (you can specify the name of a crashed node as an argument to the diag command to show diagnostics for only that one node). issue the stop command to terminate the monitoring. The status command should indicate all nodes as stopped when they have all stopped. The exit command terminates the shell session (you can exit ZeekControl while Zeek is running), see Figure 6.
After confirming that everything is running now, we need to change the logging format. Zeek by default will ingest all the traffic in Tap Seperator Value (TSV) format this format is not compatible with Splunk so we need to change it to Jason format, the changes will be written on the local.zeek file.
When ZeekControl sends mail to the address specified in MailTo, it does so for a variety of reasons (note that ZeekControl will not be able to send any mail when the value of the SendMail option is an empty string). The logs are stored in Zeek in JSON format with this architecture.
Security event logging and monitoring are two components of a single process that are crucial to the upkeep of secure infrastructure. Every action in your environment, from emails to logins to firewall modifications, is a security event. All these events are logged, so you can stay on top of what’s going on in your IT environment. Security event logging and monitoring are only useful if they’re part of a larger data collection and analysis procedure. Security logs can hold a significant quantity of data. It will be so dense that the human eye will be unable to distinguish hazards within it. For this reason, companies need to implement security information and event management (SIEM) technology.
Figure 5
|
Figure 5 Node. Cfg |
Figure 6
|
Figure 6 Test Zeek Configuration Using Status Command |
In the cybersecurity business, Splunk is one of the most extensively utilized SIEMs. Splunk basically collects logs and datasets from a variety of sources and correlates them for easy searching, parsing, and indexing. After installing the Windows Server, we will host our Splunk instance on it. Splunk utilizes a technology known as the universal forwarder to log actions on endpoints. To advance logs to your Splunk instance, the universal forward can be installed on Windows, Linux, and Mac agents to forward logs from these agents to the Splunk server.
In our project, we are trying to detect and respond to brute force attacks, phishing attacks, port scanning attacks, and the existing vulnerability. The detection process will start with the IDS, which is listening to the different subnets and monitoring them continuously, then forwarding the logs to the Splunk server, which we already configure to detect these types of threats using customized rules. This rule can trigger an alert, which will finally trigger the automated playbook programmed as a response to a specific threat.
Alerts are actions that are triggered in Splunk when a user-defined criterion is met. Among other things, alerts can be used to log an action, send an email, or output a result to a lookup file. In this case, an alert will be used to trigger automated action on the SOAR platform. A saved search, type and trigger condition adjustments, and alert actions make up alerts. Here are some details on how an alert’s various components interact. Start by looking up the events you want to remember. Make a mental note of the search and set up an alert for it. Using the saved search, the alert looks for events. Change the alert type to control how often the search runs. Set up a scheduled alert to keep an eye on things on a regular basis. You can also use a real-time alert to monitor events in real time. One or more alert actions can be initiated when an alert is triggered. By informing you of a triggered alert, an alert action can assist you in reacting to it. The frequency and kind of alert action can be customized.
Every day, security teams are tasked with dealing with threats originating from the cloud, endpoints, networks, email, and other sources. Many activities are redundant, wasting security analysts’ valuable time while dealing with high-priority threats. Automation saves time, improves analyst productivity, and broadens threat cover- age. DTonomy provides a platform for security analysts to orchestrate and automate siloed security products with hundreds of built-in connectors. SOC Teams can now automate common security activities like security control validation, cloud security response, and phishing email analysis from a single platform within DTonomy. The security team can use DTonomy’s AI-based analysis and reaction to unlock additional security automation, maximize the ROI of current security investments, and decrease risks jointly.
7. IMPLEMENTATION
DETAILS
Security event logging and monitoring are two components of a single process that are crucial to the upkeep of secure infrastructure. Every action in your environment, from emails to logins to firewall modifications, is a security event. All these events are logged, so you can stay on top of what’s going on in your IT environment. Security event logging and monitoring are only useful if they’re part of a larger data collection and analysis procedure. Security logs can hold a significant quantity of data. It will be so dense that the human eye will be unable to distinguish hazards within it. For this reason, companies need to implement security information and event management (SIEM) technology.
In the cybersecurity business, Splunk is one of the most extensively utilized SIEMs. Splunk basically collects logs and datasets from a variety of sources and correlates them for easy searching, parsing, and indexing. After installing the Windows Server, we will host our Splunk instance on it. Splunk utilizes a technology known as the universal forwarder to log actions on endpoints. To advance logs to your Splunk instance, the universal forward can be installed on Windows, Linux, and Mac agents to forward logs from these agents to the Splunk server.
Splunk forwarder is one of the Splunk infrastructure components. Splunk For- warder is a log-collecting agent that collects logs from distant workstations. The Splunk forwarder receives logs from distant workstations and sends them to the indexer (Splunk database) for processing. Splunk Forwarder uses just 1.5 percent of the CPU, compared to other typical monitoring tool agents. Splunk universal forwarders collect data from remote sources in a secure and dependable manner and transfer it to Splunk Enterprise for indexing and aggregation. They can gather gigabytes of data from tens of thousands of remote computers with negligible performance effects.
Splunk forwarders are divided into two categories. The first is the universal for- warder (UF), which is a Splunk agent deployed on a non-Splunk system that collects data locally but cannot interpret or index it. Heavy weight forwarder (HWF) is the second option, which is a complete instance of Splunk with advanced capability. Because they parse data, they are not recommended for production systems and function as a remote collector, intermediate forwarder, and maybe a data filter.
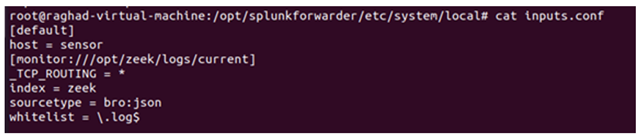
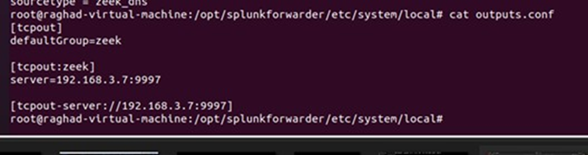
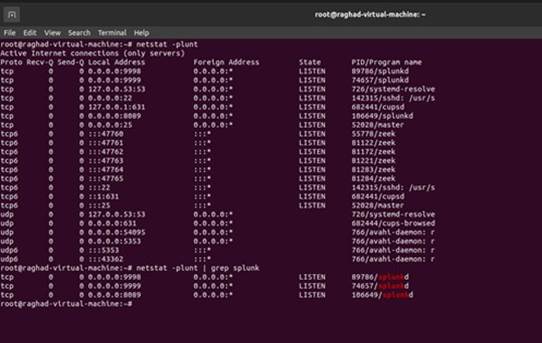
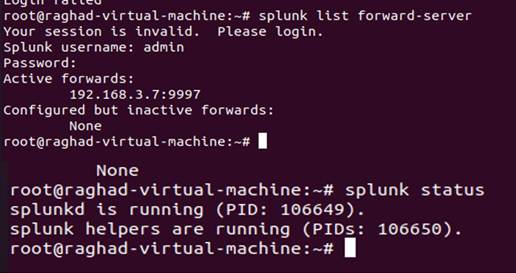
In this project, all the traffic will be stored and monitored by Zeek IDS. Zeek is a non-Splunk system, so we need to use the universal forwarder to forward all the logs to the Splunk server. Our Zeek IDS is installed on the Ubuntu server; therefore, the universal forwarder will be in Ubuntu as well. After installing the Splunk Universal Forwarder, we must configure it and then start forwarding the logs to the Splunk server. The first file we need to configure is the input.conf file. The [default] stanza sets the global configurations that will be applied for all the input types. Here we will set the host sensor as a global parameter. In addition to that, we need to specify our first input, in other words, the source of logs. The first input will be forwarded from //opt/zeek.logs/current, which means we will monitor the whole current folder of zeek logs. Some companies believed that they only needed to monitor Weird. Logs that contain unusual or exceptional logs. In our project, we will tunnel all the logs to the Splunk server to provide full visibility of the network. After specifying the path of the input, we need to configure some other parameters, such as the index, where all the logs will be stored. The other parameter is the sourcetype, which will be the format type of the logs, see Figure 7. In Splunk server we need to create the index with the same name defined in the forwarder input.conf. Next, we need to configure the outputs.conf file of the universal forwarder. Outputs.conf is only used by forwarders. Outputs.conf controls how data is sent from the forwarder to receiving Splunk. Instances, such as indexers or other forwarders with specified port. First, we need to specify the preferred listening port and check its state by running the netstat command, see Figures 8 and 9. After configuring the universal forwarder with the required settings. finally, the testing part reached. We will list the active forwarder and check the status of our configured forwarder as shown in Figure 10.
Figure 7
|
Figure 7 Parameters Configuration of Splunk Universal Forwarder. |
Figure 8
|
Figure 8 Display Outputs. Con File |
7.1. Phishing
Attack
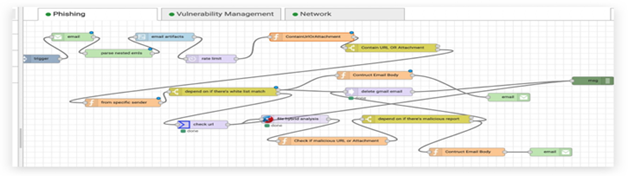
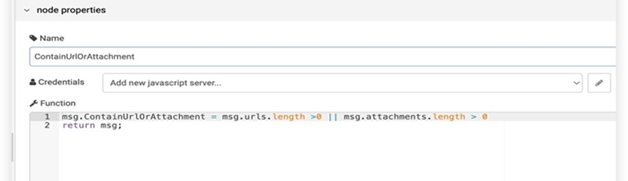
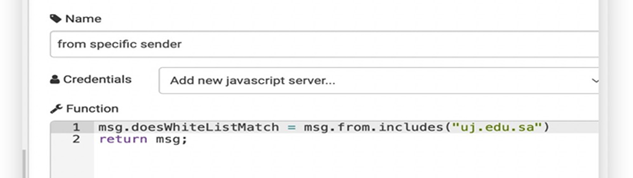
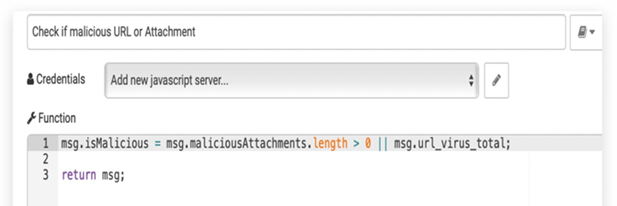
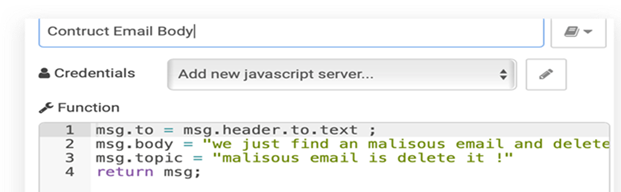
In this use case, we want to protect the employee from reviving and opening any malicious email. The malicious email may contain a malicious URL or malicious attachment. Malicious email attachments are meant to infect a user’s machine with malware. These malicious emails’ attachments might be disguised as papers, PDFs, e-files, and voicemails. Attackers send these files over email, where they can be used to install mal- ware that can damage data and steal information. A malicious URL is a clickable link that leads to a malicious or otherwise deceptive web page or website. Figure 11 shows phishing attack playbook. We used two additional tools: the first one is Urlscsnio to scan the URL, and the second one is File Hybrid Analysis to scan the attachment and decide if it is malicious or not. the playbook we designed for generating the response. The playbook will be triggered every time the user receives an email. First, we will decide if the URL is from a blacklisted user or not. If so, we will delete the email. then we will check if it has an attachment or URL and scan it to detect any malicious content. If the email contains any malicious content, it will be deleted from the user’s inbox and sent to him as a warning. Figure 12 shows the function used to decide if the email contains an attachment or URL. Now, we need to prepare the email source to check if it internal or external email. The function in Figure 13 check if the emails coming from the uj.edu.sa domain or not, by checking msg.from object. The node in Figure 14 is a function constructed to check the scan results of previous nodes. First, we will perform URL scanning and attachment scanning. Then, we will call the function to check the if the overall email is malicious or not. After finalizing the decision about whether the email is malicious or not, we will move on to the final step. If the email is malicious, delete it and warn the receiver with the warning email. The node in Figure 15 is a function used to construct the warning email.
Figure 9
|
Figure 9 Run Netstat Command |
Figure 10
|
Figure 10 Run Netstat Command |
7.2. Port Scanning
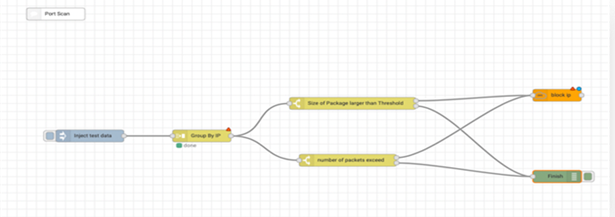
Port scanning is a way for attackers to find the attack surface of the target organization; therefore, they will be able to plan for an attack or for the following phase of an attack. To detect it, we searched in the Splunk logs using the stats command, which gives us the distinct number of IPs and ports used per source IP, per hour, and filtered the result for more than 5 source IPs or detention ports. Next, we created the alert for the SQL command, which will be triggered every time a log matches the SQL command. We set its severity to high. After the attack is detected and an alert is triggered, port scan alerts will be sent to the SAOR platform, which will start the auto-response process according to the designed port scan playbook, which is shown in Figure 16.
Figure 11
|
Figure 11 Phishing Attack Playbook |
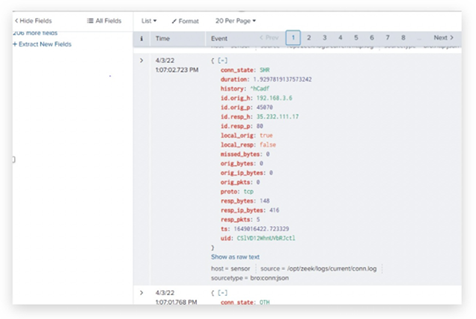
7.3. Brute Force Attack
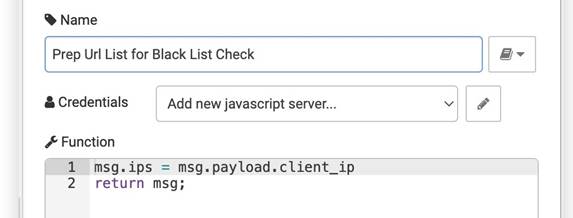
This use case is expected to identify source IPs that exceed the high threshold of failure login attempts. We need to prepare the logs with the necessary fields (as shown in Figure 17). So Splunk will be able to detect the attack based on these fields. A brute force alert will be triggered when there are five or more failed authentication attempts within 10 minutes. The SOAR platform will receive the alerts from Splunk and trigger brute force playbook to start auto-response process, see Figure 18. Splunk node will return the whole record. We used the function illustrated in Figure 19 to extract the IP of the attacker to block him in the firewall. Since we don’t have access to the ARP table, we created the playbook and filled it with random values. We are willing to include the ARP table check feature in future work. After extracting the IP address, we can now block the attacker by initiating an SSH connection between the SOAR platform and the firewall, see Figure 20. When the SSH connection is established, the SSH node will execute the easyrule block command remotely and block the attacker from the firewall.
Figure 12
|
Figure 12 Check Email Content |
Figure 13
|
Figure 13 Email from Insider |
Figure 14
|
Figure 14 Check Malicious Email |
Figure 15
|
Figure 15 Construct Warning Email |
Figure 16
|
Figure 16 Port Scanning Playbook |
7.4. Vulnerability Management
In this use case, we want to detect all the vulnerabilities in our network because they’re weaknesses that can be exploited by malicious hackers, so it’s a way to successfully attack and needs to be addressed. Nessus is a security scanning tool and one of the best network protection tools. It helps to scan and detect all vulnerabilities and provides the appropriate solution to them. We used Nessus to do the network scan. We scan all three subnets (DMZ, LAN1, LAN2).
Figure 17
|
Figure 17 Logs of Brute Force |
Figure 18
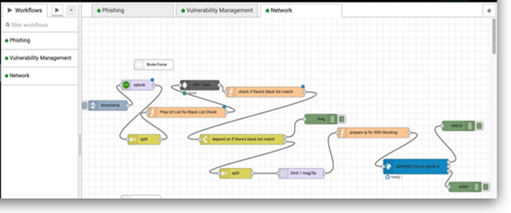
|
Figure 18 Brute Force Playbook |
8. RESULTS AND DISCUSSION
We have tested our system to ensure that it meets the requirements. Tests were con- ducted to evaluate the whole system and make sure it worked properly. For testing the Firewall Testing, we need two machines to test the firewall’s main functionalities. First, we need to ensure that the firewall blocks the SSH connection between the DMZ. The second test is examining the firewall’s ability to forward all the traffic through it by acting as a default gateway. We start by running the ipconfig/ifconfig commands to ensure that the firewall IP is set as the default gateway for each machine. Also, we tested the internet connectivity since we changed the gateway from the router to the firewall. So we examined every machine that has an internet connection. For ZEEK IDS Testing, We have tested Zeek’s ability to monitor all the traffic on each interface and store the logs in JSON format. For Splunk SIEM Testing, On the Splunk plat- form, we are collecting the logs, performing the log analysis, and generating the alert for each attack. We have tested that all the logs were forwarded to Splunk success- fully. Then we tested the brute force alert by brute-forcing the internal machines in the LAN subnet and ensuring Splunk generated an alert for each attack attempt.
Figure 19
|
Figure 19 Extract IP Address to Block Brute Force Attempts |
We used the NGROK software to expose the local host. Ngrok is the fastest way to put an app on the internet. Test and integrate the components that are present locally on the local host and on the internet (in the cloud). Ngrok is the programmable network edge that adds connectivity, security, and observability to your systems with no code changes. Our project’s main objective is to monitor, detect, and respond to threats. For monitoring, we used the ZEEK IDS, which is installed locally; the detection process is performed locally in Splunk; and finally, the response process is done by the SOAR Dotonmy platform, which is the cloud-based solution (since we could not install the pre-planned local solution). We need to integrate all the components together, including the pfsense firewall, to block the source address or port. Since we are using a cloud-based SOAR solution (Dotonomy), we need to expose the localhost to the internet using NGROK. First, we started by exposing the localhost of the Splunk server to forward the triggered alert to Dotonmy using the REST API to trigger the customized playbook. Second, we exposed the ssh connection to the Pfsense firewall to the internet. Then we integrate this ssh connection with SOAR Dotnomy to communicate with the Pfsense shell for blocking any malicious connections. Also, we tested the integration between Dotnomy and the email inbox of the employee in the phishing use case. Finally, we tested the integration between Dotonmy and Windows XP to update the system. Our system is compatible and runs on many machines with different operating systems and versions to provide more compatibility. Table 2 depicts the compatibility of the proposed system.
The proposed system can detect and responding to different types of brute-force attacks, regardless of whether they are initiated locally or from an outsider. The response is performed by blocking the sender from the firewall. For phishing emails, the system detects if the email is coming from a blacklisted sender, then deletes it. Scan the email to see if it contains a malicious URL or attachment and delete it. Then inform the employee that he received a malicious email. If the email is not coming from the backlisted user and does not contain malicious content, it will be stored in the employee’s inbox. Additionally, the system can detect port scanning attempts and responses by closing the port from the firewall remotely, as well as performing a vulnerability scan and detecting the existence of a vulnerable system. Unfortunately, our system cannot perform automated updates to increase the level of security of the corporate network. This is because we could not integrate the vulnerability scanner, as the SOAR solution is not compatible with any local vulnerability scanner.
Figure 20
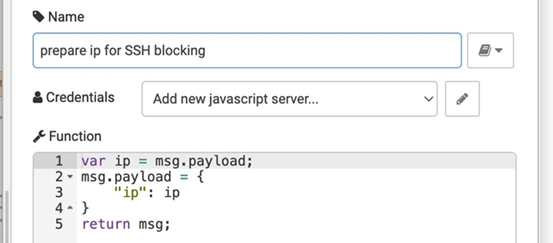
|
Figure 20 SSH Connection between the SOAR Platform and the Firewall |
Table 2
|
Table 2 System Compatibility |
|||
|
Machine No. |
Machine Name |
Characteristics |
Status |
|
1 |
Windows desktop 10 |
2 GP RAM /i7 pro- cessor(virtually) |
Success |
|
2 |
Windows server |
2 GP RAM /i7 pro- cessor(virtually) |
Success |
|
3 |
Windows XP |
1 GP RAM /i7 pro- cessor(virtually) |
Success |
|
4 |
Ubuntu |
2 GP RAM /i7 pro- cessor(virtually) |
Failed |
|
5 |
Ubuntu |
2 GP RAM /i7 pro- cessor(virtually) |
Success |
|
6 |
macOS |
8 GP RAM /i5 pro- cessor |
Success |
|
7 |
Kali Linux |
2 GP RAM /i7 pro- cessor(virtually) |
Success |
|
8 |
Pfsense firewall 6 |
3 GP RAM /i7 pro- cessor(virtually) |
Success |
|
9 |
Pfsense firewall 5 |
3 GP RAM /i7 pro- cessor(virtually) |
Failed |
9. CONCLUSION
In conclusion, this research is an illustration of building a Security Operation Center (SOC). This project is not just to generate an automated response but is focused on improving the response as optimally as possible. Automation responses are done in compliance with cyber security best practices. There are absolutely some improvements to be made in the future to improve the environment. For further work, we will implement a SOAR solution locally and communicate with Nexpose to implement their vulnerability scanner solution on the system. Additionally, we will include the MAC address in the logs to overcome IP spoofing threats and automate more use cases.
CONFLICT OF INTERESTS
None.
ACKNOWLEDGMENTS
None.
REFERENCES
Islam, C., Babar, M. A., & Nepal, S. (2020). Architecture-Centric Support for Integrating Security Tools in a Security Orchestration Platform. Software Architecture: 14th European Conference, ECSA 2020, L'Aquila, Italy, September 14-18, 2020, Proceedings 14, 165-181. https://doi.org/10.1007/978-3-030-58923-3_11
Kallimath, V., & Savalagimath, C. (2021). The Complete Guide to Security Orchestration, Automation, and Response (SOAR). Happiest Minds.
Kraeva, I., & Yakhyaeva, G. (2021). Application of Metric Learning for Security Incident Playbook Recommendation. 2021 IEEE 22nd International Conference of Young Professionals. https://doi.org/10.1109/EDM52169.2021.9507632
Nguyen, P., Dautov, R., Song, H., Rego, A., Iturbe, E., Rios, E., Sagasti, D., Nicolas, G., Valdés, V., & Mallouli, W. (2023). Towards Smarter Security Orchestration and Automatic Response for CPS and IoT. 2023 IEEE International Conference on Cloud Computing Technology and Science (CloudCom), 298-302. IEEE. https://doi.org/10.1109/CloudCom59040.2023.00055
Nyre-Yu, M., Gutzwiller, R. S., & Caldwell, B. S. (2019). Observing Cybersecurity Incident Response: Qualitative Themes from Field Research. Proceedings of the Human Factors and Ergonomics Society Annual Meeting, 63(1), 437-441. https://doi.org/10.1177/1071181319631016
Ohmori, M. (2019). On Automation and Orchestration of an Initial Computer Security Incident Response by Introducing a Centralized Incident Tracking System. Journal of Information Processing, 27, 564-573. https://doi.org/10.2197/ipsjjip.27.564
Purujoki, J. (2020). SOAR Playbook
Implementation Incident Deduplication
and its Effects (Bachelor's Thesis, JAMK University of Applied
Sciences).
Team, R. F. (2019). SOAR use Cases for Effectively Mitigating Cyber Threats Part 2.
Torkura, K. A., Sukmana, M. I., Cheng, F., & Meinel, C. (2019). Slingshot-Automated Threat Detection and Incident Response in Multi-Cloud Storage Systems. 2019 IEEE 18th International Symposium on Network Computing and Applications (NCA), 1-5. IEEE. https://doi.org/10.1109/NCA.2019.8935040
Zwuiany Muhanad, H. D. A. (2015). DBFST: Detecting Distributed Brute Force Attacks on a Single Target. International Journal of Scientific and Engineering Research, 6.
|
|
 This work is licensed under a: Creative Commons Attribution 4.0 International License
© DigiSecForensics 2025. All Rights Reserved.